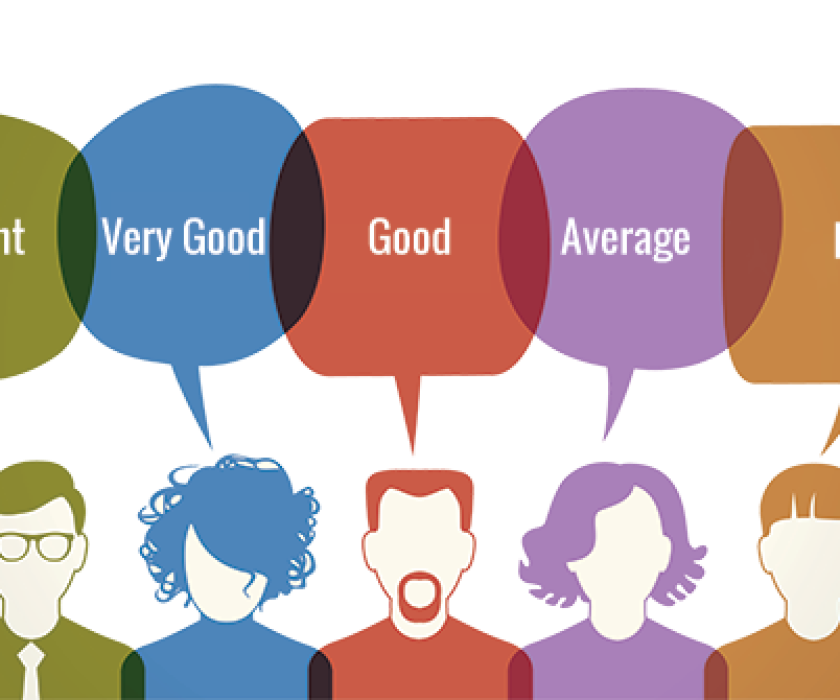
Infographic: Why Use Infographics in Digital Marketing?
The use of Infographics is a trend that’s changing how we share, curate and organise online information. An infographic is an efficient way of putting together images, text and design to create a content that tends to shared across a wide range of online platforms.
If you are sure whether or not to integrate them into your digital marketing strategy, find bellow the reasons that might convince you of its importance and make use of them.
#1 – It helps SEO
A lot of content is being produced and shared online. Thus, without a strategy for producing content, you can never get good and authoritative links. A good link portfolio is extremely useful for SEO as it can improve to a better search engine position and hence more people will visit your website.
#2 – Attracts people’s attention
We like visual content. That means we are more likely to remember and be attracted by an image rather than a long text. In fact, about 90% of data that goes to our brain are visual. Thus, if you want to draw attention with an infographic in social media platforms like Pinterest, Instagram and Snapchat will help! If your data is colourful, interesting and engaging, more people will take time to look at it.
#3 – It has the potential to go viral
Tweets containing infographics are retweeted 832 percent more than the standard tweets. In addition to that, Slideshare found out that online users are three times more likely to share infographics than documents on their social handles.
#4 – Show expertise
People love to see an interesting statistic. If you are also showcase your knowledge in a topic which an infographic can help you successfully do it, you need to invest time and research the subject in order to get good data that will be useful to your audience. In addition, the best infographics have an easy flow such this is relevant not only to the customer but one another.
Conclusion
The age of big data is here. Yet, we don’t have time to absorb the data. Infographics are packed with charts, graphs, maps and other visual content which makes it easier for even those who don’t understand statistics to absorb and understand the data. Knowledge is power and additionally this means that your company cares about current trends and can show your expertise in its area.


